Collaborative for Community Engagement
CCE By-the-Numbers
Explore This Section
Our Work
For Faculty
- Collaborate with the CCE
- Join the Engaged Faculty Listserv
- Attend Events and Workshops
- Teach a Community-Engaged Learning Course
- Find a Community Partner
- Get Started with Community-Engaged Research
- Apply for Funding
- Faculty Engagement Opportunities
- How Might We Support CEL Teaching? Share Your Ideas Here.
Overview
The CCE started recording more detailed engagement data in 2017. Engagement data is reported for CCE programs, student org participation, workshop attendance, community-based learning courses, athletics, and more. Although we can't capture everything that happens every year, we're proud of the activity this data represents and continue to work to provide more pathways for students to engage and learn every year.
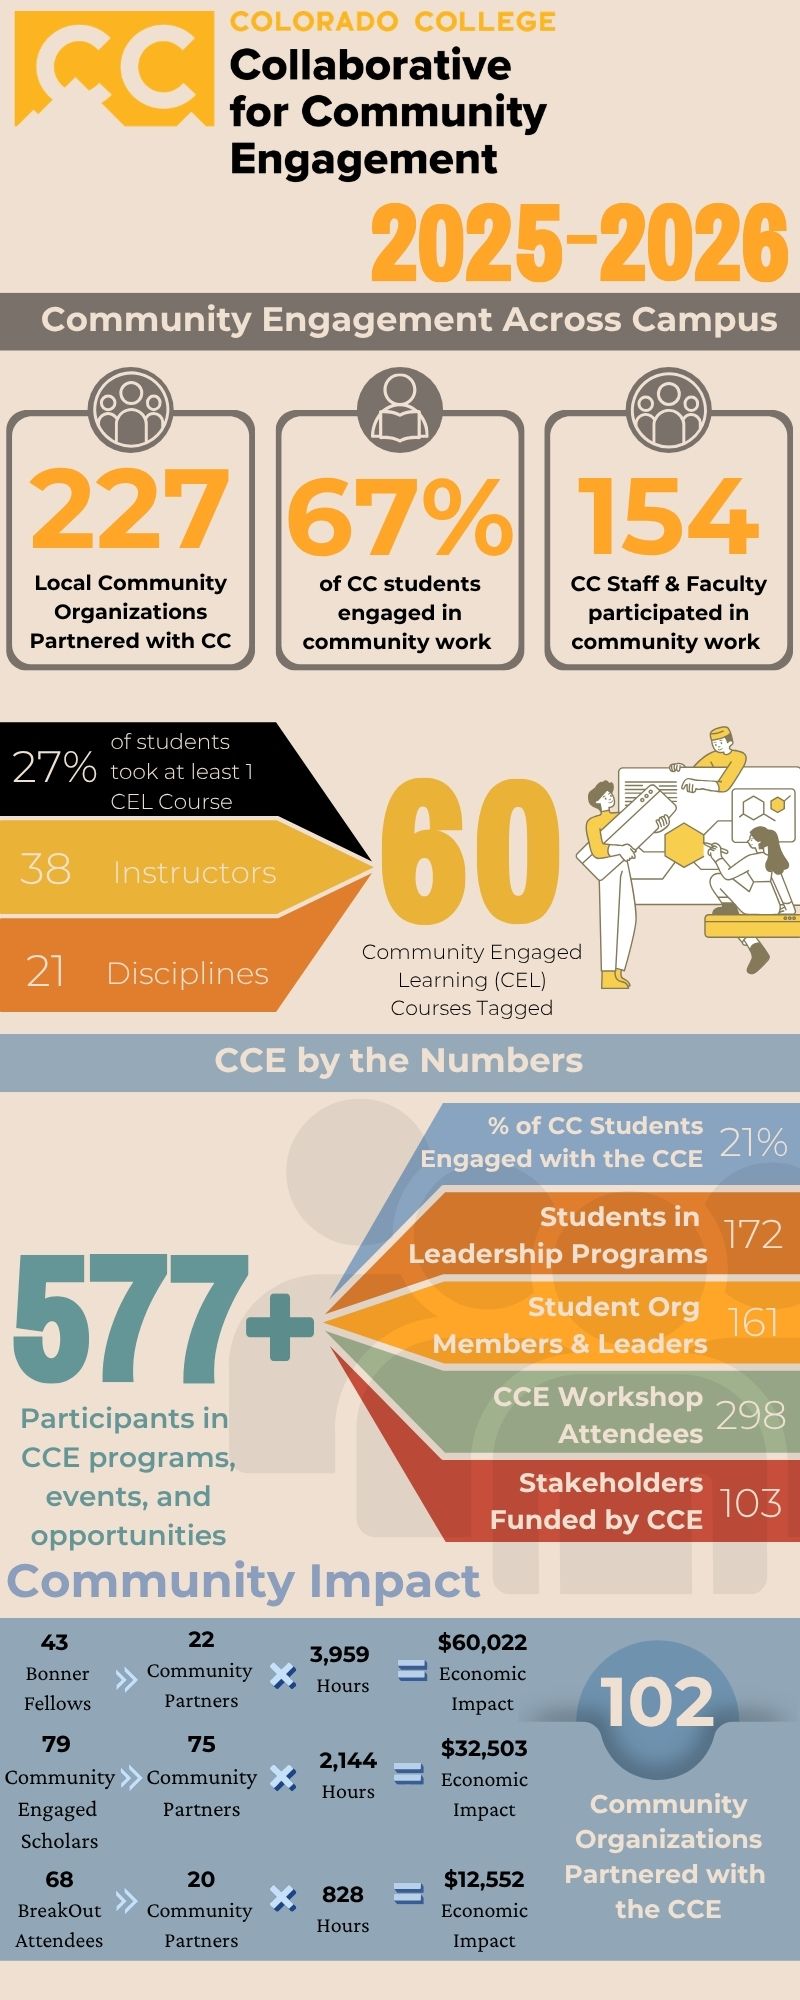
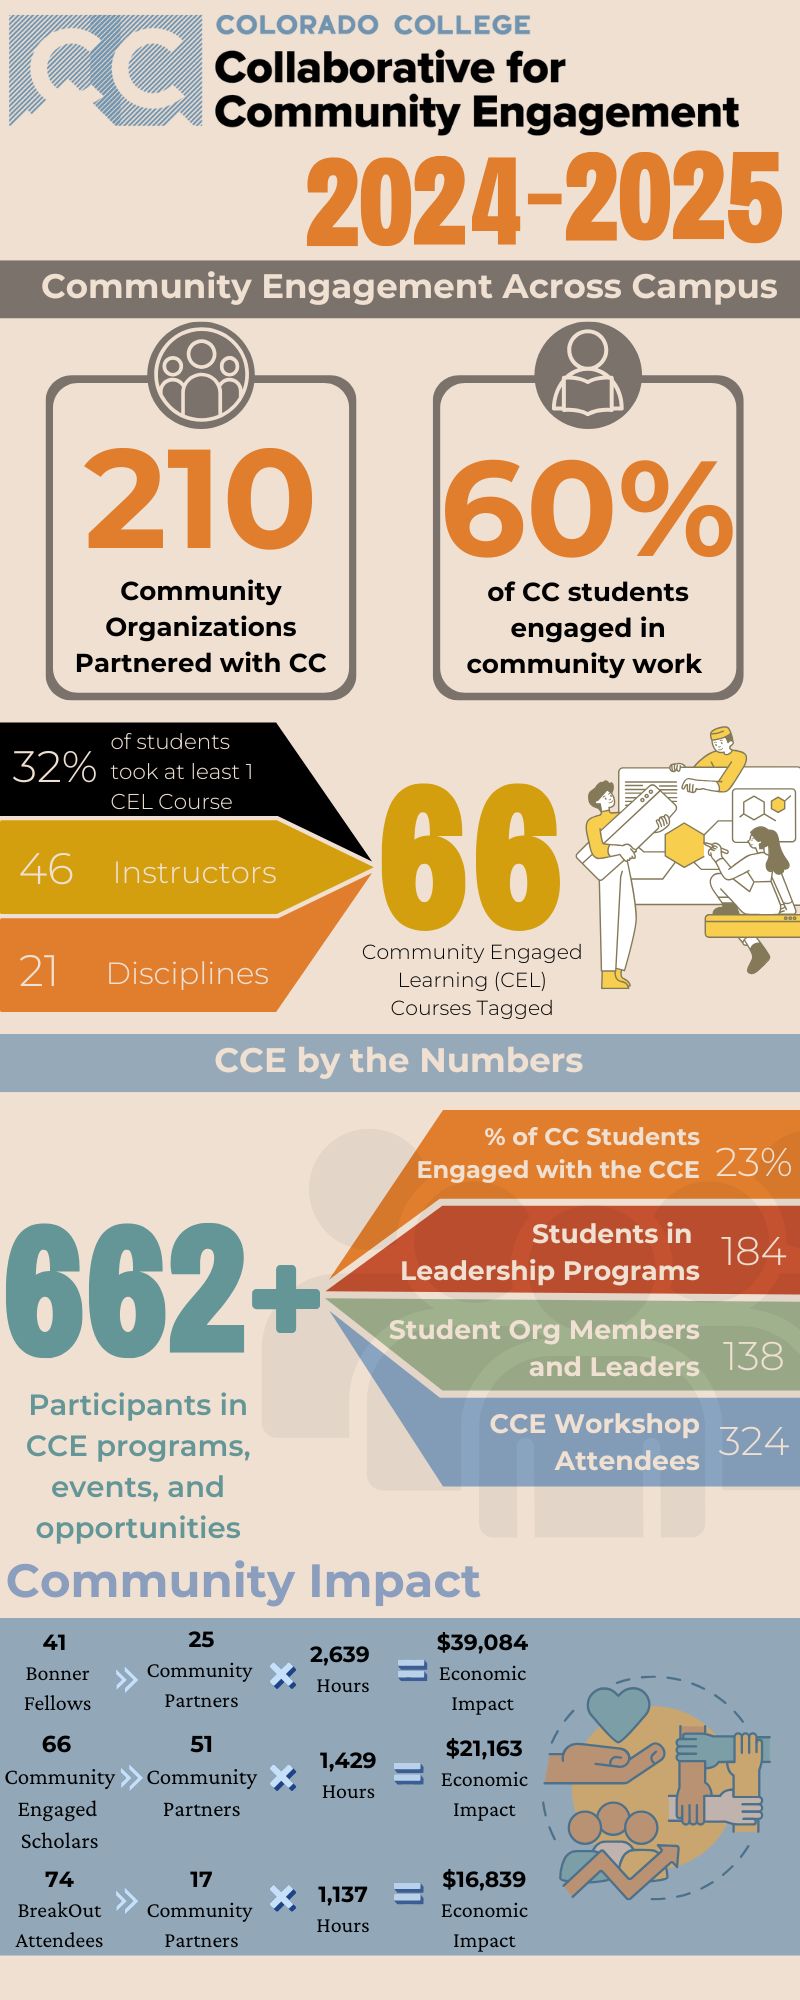
2024-2025 Community Engagement Infographic
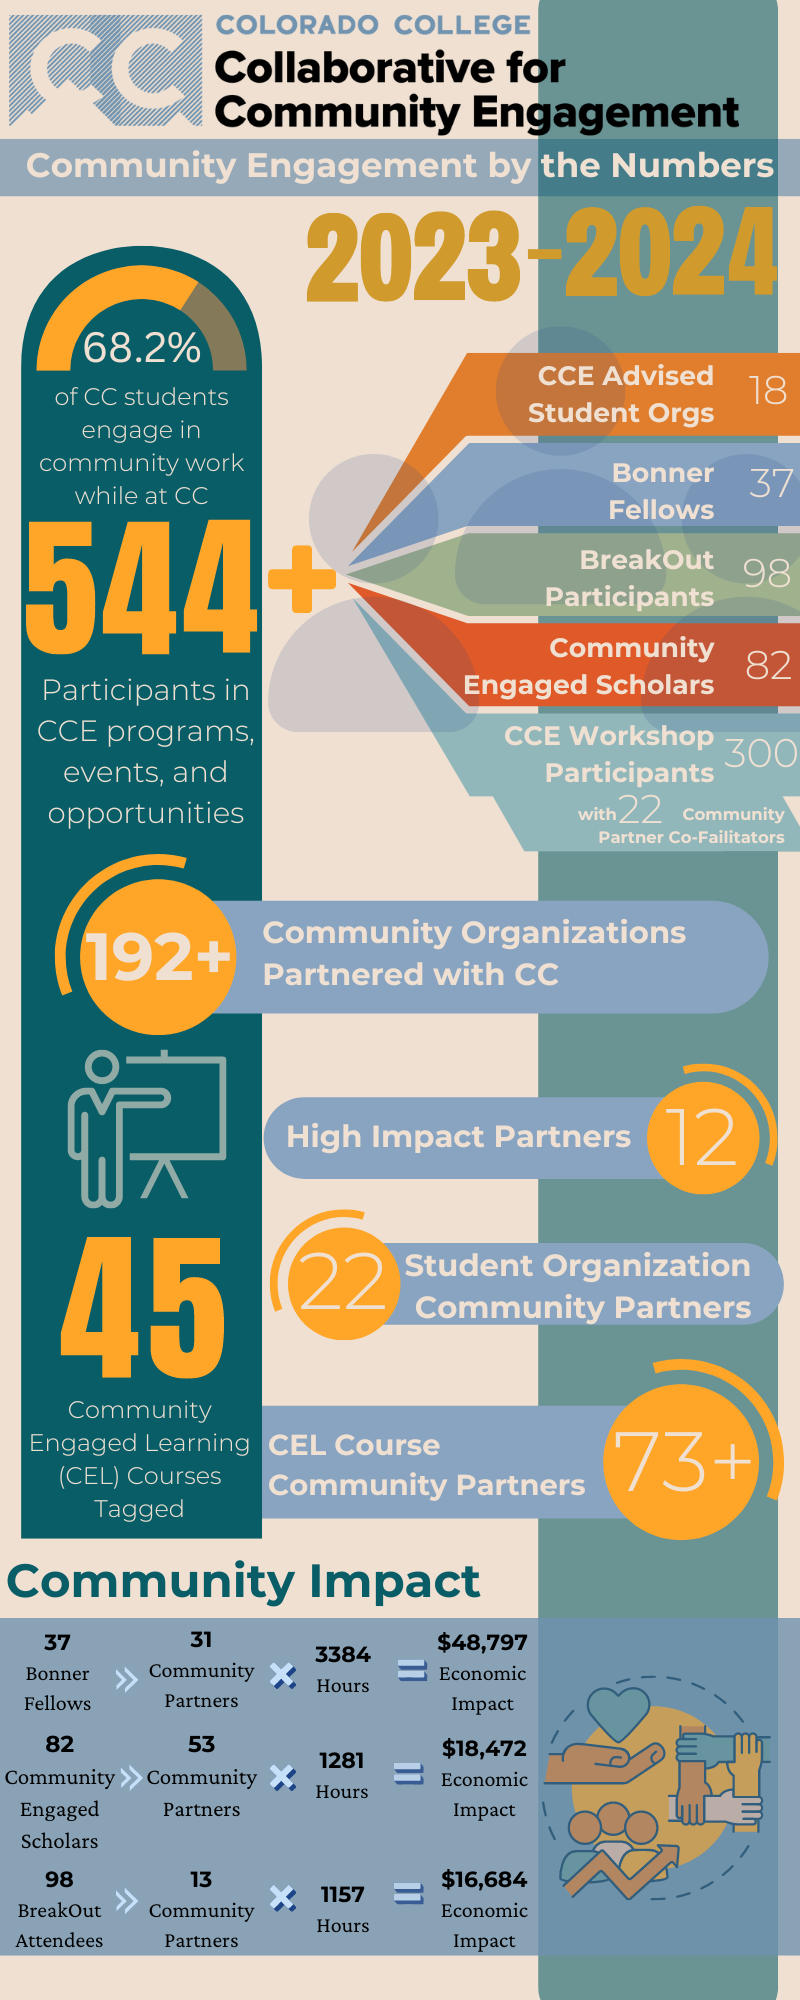
2023-2024 Community Engagement Infographic
Report an issue -
Last updated: 05/01/2026